This is post is incredibly late!
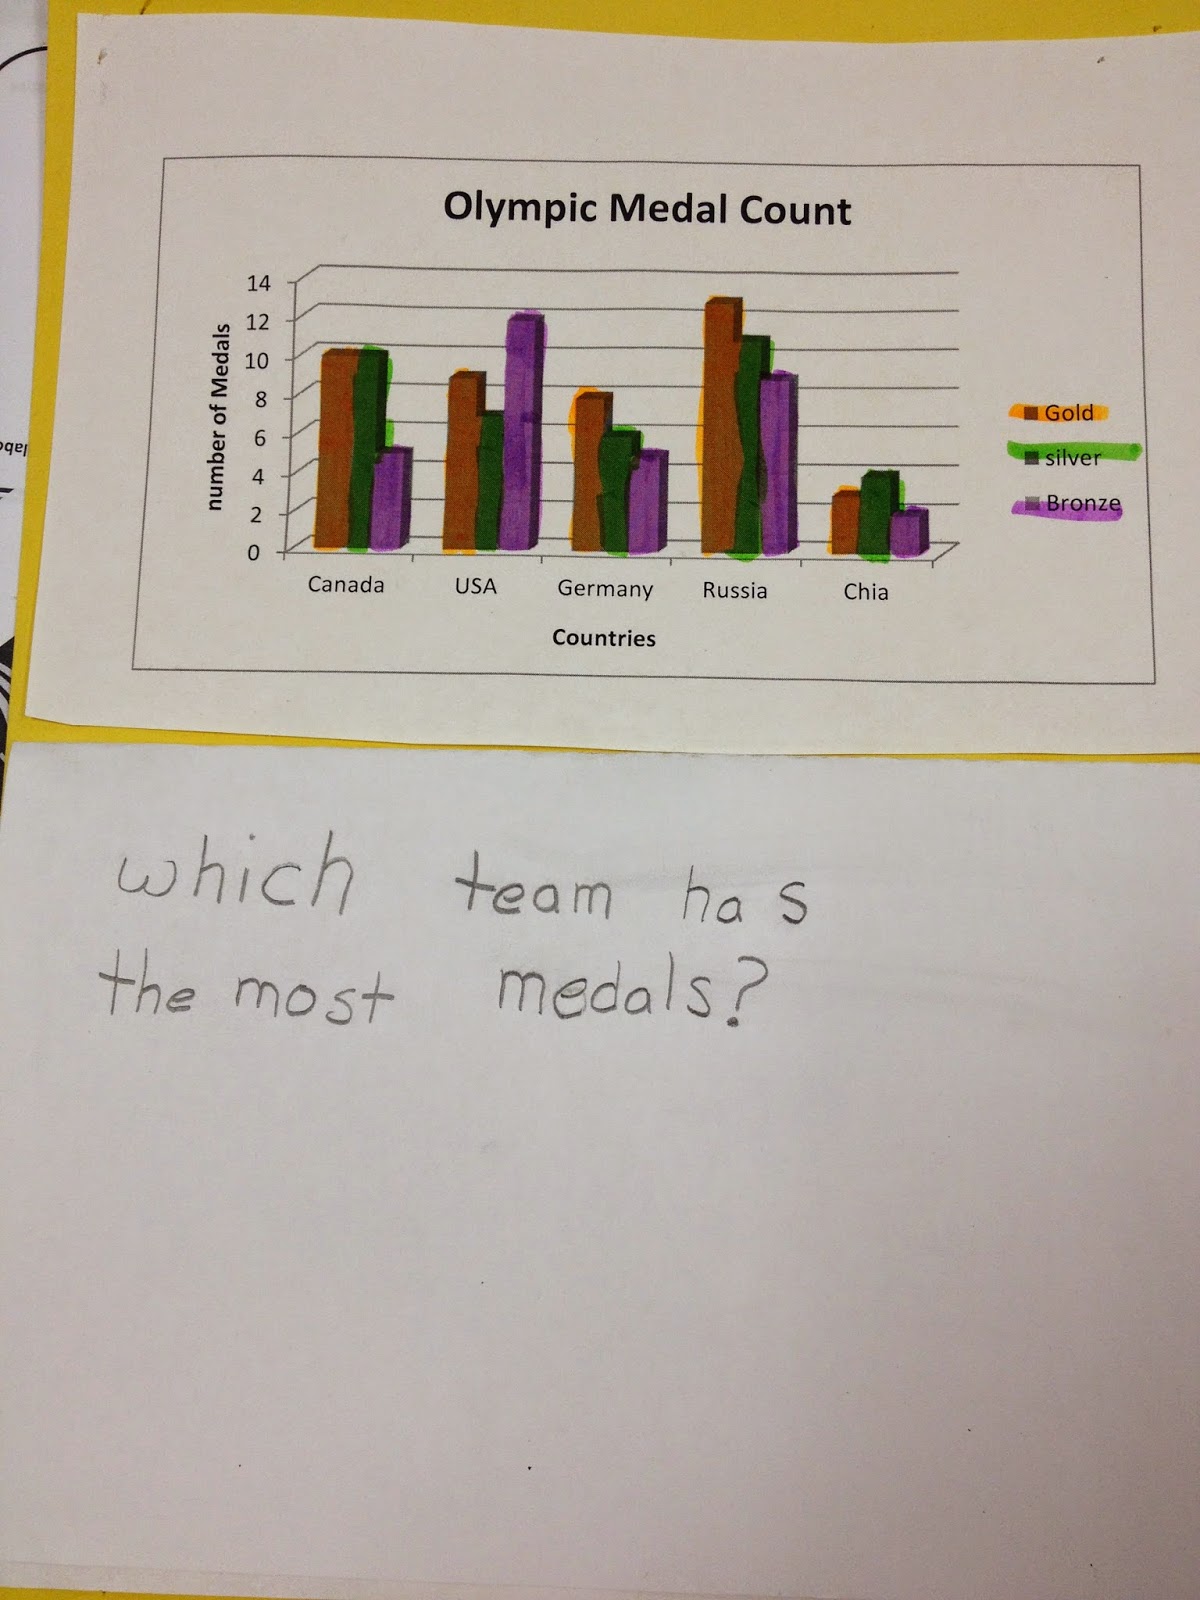
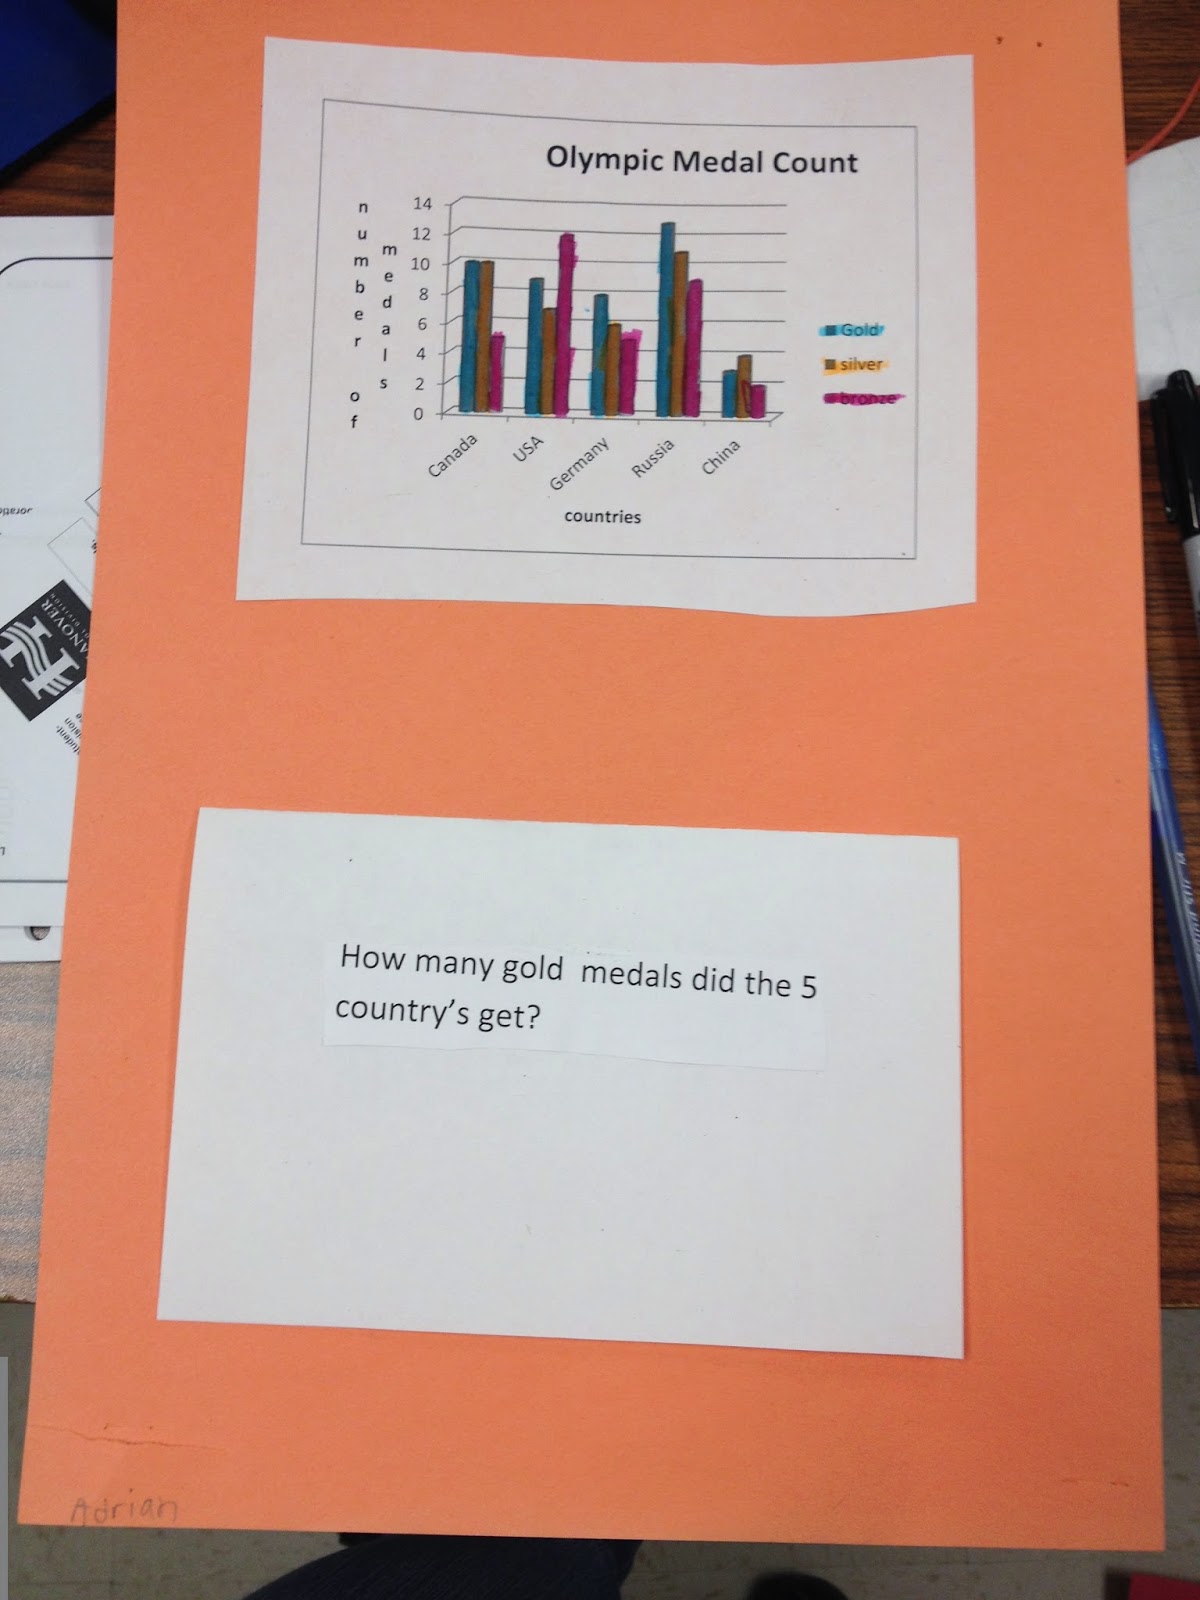
During the Olympic Games we kept track of 5 countries and the medals they received (we chose to keep track of Canada, USA, Germany, Russia, and China). We kept track of them by making bar graphs (keeping track of each countries gold, silver, and bronze medals) and then in the hallway we kept track of each countries total medal count with a pictograph.
Why bar and pictographs?
Those are the only 2 graphs my grade 4's need to know this year.
After the olympics were over I brought them to the computer lab to learn about Microsoft Excel and we put the information from our bar graphs into there and printed out a graph.
Then we glued that graph onto a piece of construction paper and wrote a question that could be answered by looking at the graph. Some students did some really complicated questions... some students did some pretty simple ones... I just let them come up with a question that they were capable of answering.
They wrote their question on a piece of white paper, folded it in half and wrote the answer the question on the inside (so that someone walking by could flip up the piece of paper to see the answer)
Here are some of my students graphs, questions, and answers
(we've since been working on showing our work)


No comments:
Post a Comment